Last updated on February 12th, 2026 at 08:08 pm
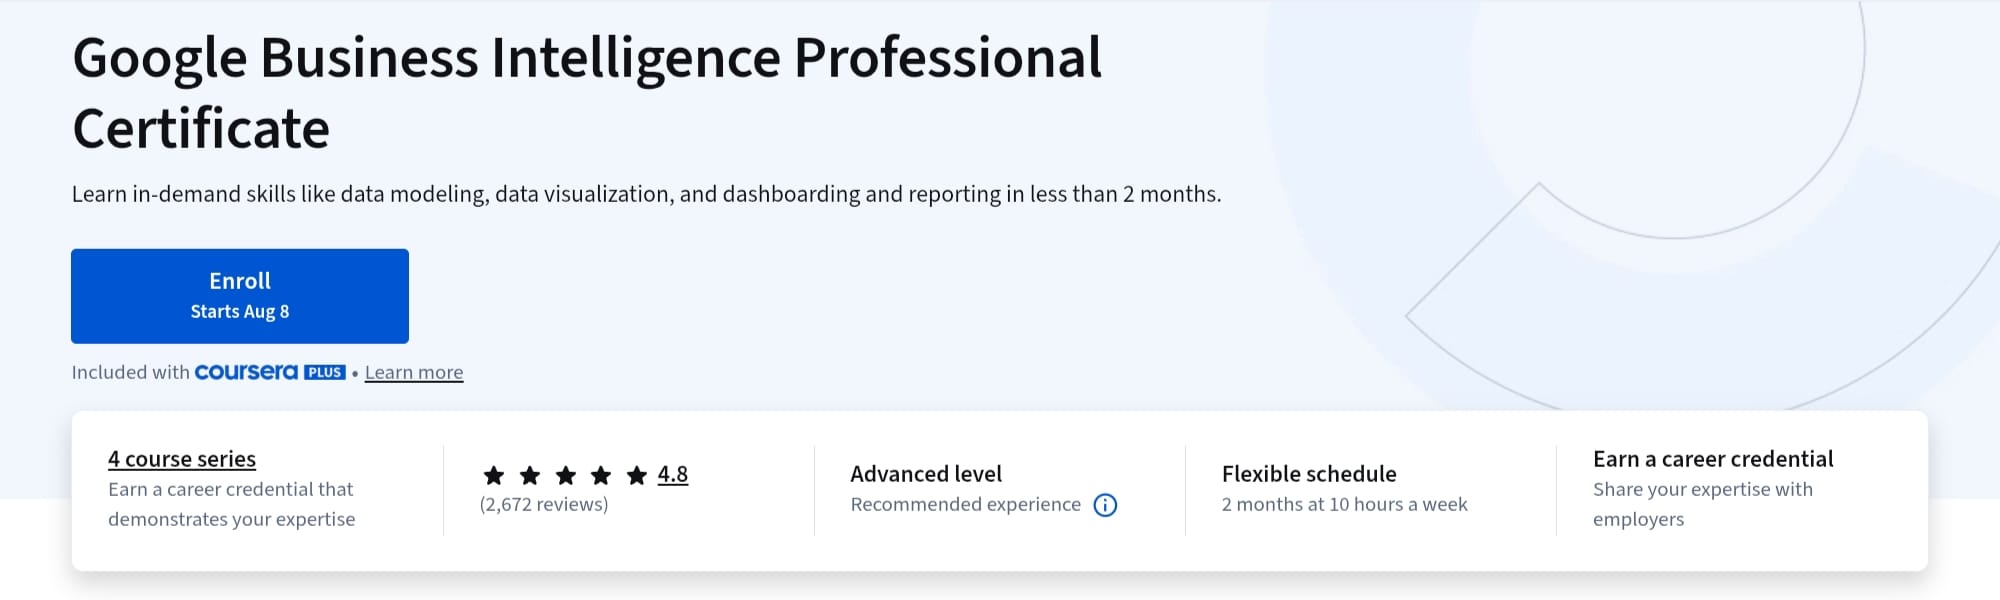
The Google Business Intelligence (BI) Professional Certificate on Coursera is an industry-recognized program that helps students develop business intelligence abilities that are ready for the workplace.
This course, which was created by Google and is a part of its career certificate series, is designed for people who want to work as associates or BI analysts.
It highlights the analytical mentality, data storytelling, and dashboard development skills that companies will need in 2025 through a hands-on, tool-driven program.
Let’s discuss if this course is a good fit for your objectives.
What Skills Will You Learn in This Course?
The goal of the Google Business Intelligence Professional Certificate is to give students the comprehensive set of abilities needed to begin a career in business intelligence. It emphasizes both technical expertise and business savvy, making sure you’re using data to make better decisions rather than just crunching numbers. Here’s a closer look at the skills you’ll get.
Data Modeling
You’ll discover how to create and organize data models that faithfully depict actual business situations. The course presents:
- Methods of dimensional modeling (such as snowflake and star schemas)
- How to make dimension and fact tables
- Data modeling’s function in creating scalable analytics solutions
A fundamental duty of BI experts, these skills enable you to convert unstructured data into intelligible structures that facilitate quick and effective searching.
Dashboarding and Reporting
You will gain practical experience building interactive dashboards with this course by using Looker Studio (formerly known as Google Data Studio), Tableau, and BigQuery dashboards powered by SQL.
Best practices for drill-downs, filters, layout, and KPI tracking will be taught to you. These abilities are essential for effectively communicating information to decision-makers and stakeholders.
Exploratory Data Analysis (EDA)
BI analysts need to comprehend the data before they can create dashboards. You’ll discover how to use Google Sheets and SQL to clean, sort, and arrange big data sets, execute sophisticated EDA methods like filtering, grouping, and joining using BigQuery, and find patterns, trends, and outliers that could otherwise be overlooked.
Data is transformed into useful insights through this fundamental examination.
Data Visualization
One of the course’s main objectives is to teach effective visual storytelling. You will learn the following.
- For various data narratives, choose the appropriate chart types (bar, pie, heatmaps, scatter plots, etc.).
- Create images that improve understanding without being overpowering.
- For clarity, use design concepts like color psychology, hierarchy, and white space.
This ability guarantees that your insights impact decisions rather than merely existing in a spreadsheet.
Stakeholder Communication
A skilled BI analyst must be able to connect the dots between business and data. This course teaches the following techniques.
- How to modify presentations (technical vs. non-technical) for various audiences
- Putting findings into terms of ROI and business objectives
- Transparently presenting assumptions, uncertainties, and trade-offs
You’ll become more comfortable explaining intricate findings in a way that motivates action.
BI Lifecycle & Architecture
To be truly effective, a BI professional must understand the big picture. You’ll explore:
- The business intelligence lifecycle — from data ingestion to reporting
- ETL pipelines and how data flows through systems
- Core components of data warehouses and cloud data platforms (like Google Cloud’s BigQuery)
This knowledge helps you design scalable and efficient BI solutions aligned with enterprise data strategy.
Soft Skills That Make a Difference
The curriculum highlights critical soft skills that characterize success in BI roles in addition to technical proficiency.
- Problem-Solving: Taking a logical approach to ambiguous data challenges
- Critical thinking: Assessing the reliability and applicability of ideas
- Paying close attention to details: identifying discrepancies and guaranteeing data accuracy
- Cooperation: collaborating with teams from IT, marketing, finance, and product
These human talents improve your capacity to use data to produce significant results.
What Concepts Are Taught in This Course?

The three in-depth courses that make up the Google Business Intelligence Professional Certificate are intended to build upon one another. Together, they lead students from fundamental comprehension to real-world application of business intelligence methods and tools.
To guarantee job preparedness, the program blends theory, tool training, and practical application. A closer look at the concepts covered in each course is provided below.
1. Foundations of Business Intelligence
In order to set the stage, this course explains business intelligence and how it fits into contemporary data-driven businesses. You will explore the following concepts.
Overview of Business Intelligence
What is BI? What makes it significant? You’ll comprehend the fundamental goal of business intelligence (BI), which is to use data to inform business decisions.
Positions and Duties in BI Teams
Find out about the different roles that engineers, data architects, and BI analysts play and how they work together. This aids in your comprehension of expectations and career pathways.
BI Architecture & Data Lifecycle
You will learn about the flow of data from raw gathering to informative dashboards in an organization. Among the concepts are sources and storage of data, pipelines for data, modeling data, and layers of final reporting and visualization.
BI Tools Overview
An easy-to-use introduction to common tools such as
- Looker Studio for reporting
- Tableau for dashboards that are interactive
- BigQuery for an extensive study of data
These tool summaries get you ready for subsequent, more in-depth practical use.
For students who are just beginning, this course is perfect because it covers the fundamental terminology, context, and ideas required to delve deeper into BI methods.
2. The Path to Insights: Data Models and Pipelines
The second course becomes increasingly practical and technical. The fundamental back-end procedures that underpin business intelligence systems are introduced. The following subjects are covered in this course.
Modeling Dimensional Data
Discover how to use industry-standard analytics modeling tools, such as star and snowflake schemas, to organize data. This is essential for creating scalable, effective BI solutions.
Basics of Data Warehousing
Learn about data warehouses, their differences from databases, and the importance of centralized reporting.
Orchestration and Data Pipelines
With the use of orchestration tools and pipelines, you will learn how data moves across a system. Among the concepts are:
- ETL stands for Extract, Transform, Load.
- Latency and freshness of data
- Developing repeatable and automated processes
Assets for Reusable Data
Discover how to build and manage trustworthy, reusable datasets that can be shared between reports and teams. In BI contexts, this encourages uniformity and governance.
This course helps students think like both data engineers and analysts by bridging the gap between unprocessed data and well-designed dashboards.
3. Decisions, Decisions: Dashboards and Reports
Decision-making and front-end reporting are the main topics of the last course. It is the intersection of your technical expertise and business influence. The following principles will be taught in this course.
Principles of Dashboard Design
Discover the art and science of creating strategically informative dashboards that are also aesthetically pleasing.
Selecting Appropriate Visualizations
Engage in data storytelling by choosing the right graphics and charts for the various kinds of data. Recognize when to use plots with bars, lines, scatter, tables, KPIs, treemaps, heatmaps, and other data visualization methods.
Working directly with Tableau and Looker Studio
Create dynamic dashboards with actual datasets. To produce reports that give stakeholders clear insights, you’ll make considerable use of both technologies.
KPI Creation and Business Measures
Discover how Key Performance Indicators (KPIs) are defined and monitored. This comprises determining the objectives of the business, connecting metrics to results, and assessing how well your dashboards are working.
By teaching students how to produce polished outputs that impact decision-making in actual organizations, this course unifies everything.
Who Should Join This Course?
This certificate is perfect for:
- Those new to business intelligence and those changing careers for the first time
- Future BI analysts seeking practical exposure to industry tools.
- Data enthusiasts who wish to move into business intelligence (BI) and have some prior experience with SQL or data analysis.
- Students or recent graduates want to earn a certification that will allow them to work at an entry-level position.
Although knowledge of spreadsheets and data analysis principles and skills will be beneficial, prior coding or business intelligence experience is not required.
Read Also: Advanced Data Science Courses On Coursera For Experienced Professionals
Will You Get a Job After Completing the Google Business Intelligence Certificate on Coursera?
This curriculum was created by Google with job readiness in mind. It benefits your career in the following ways:
- Employer recognition: Google Partners, Accenture, Deloitte, and other companies trust the credential, which is a part of Google Career Certificates.
- Portfolio development: As part of the projects, you will design SQL queries, construct dashboards, and produce visual reports that will demonstrate your abilities.
- Access to job boards: More than 150 organizations are looking for entry-level BI positions on this exclusive job portal, which graduates can use.
However, your general profile, networking, CV, and interview skills are also important factors in getting hired. Although it offers a powerful boost, this course does not guarantee a job.
How Long Does This Course Take to Complete?
The course is self-paced and may be finished in less than two months if you put in about ten hours a week.
Going more slowly (e.g., 5 hours per week) can take three to four months.
Every course consists of reading materials, videos, practical laboratories, tests, and assignments that are rated by peers.
How Much Does This Course Cost?
You can access this course on Coursera with the subscription model. This professional certificate costs $20 per month on Coursera.
Also, you can subscribe to the Coursera Plus subscription plan, which costs approximately $59 per month (may cost less with ongoing offers and promotions) and offers access to 10,000+ courses and specializations from 350+ institutions and companies.
Coursera Plus comes with a 7-day free trial, allowing you to cancel the subscription if it does not meet your expectations.

Is It Worth Taking the Google Business Intelligence Certificate on Coursera?
Yes, most students and prospective BI specialists will find the Google Business Intelligence Professional Certificate to be well worth the investment. This course is ideal if you’re searching for a hands-on, practical, and career-focused learning route.
If you’re beginning from scratch, changing careers, or want to study SQL, BigQuery, Tableau, and Looker Studio in an organized manner, this is quite helpful. Because the certificate is from Google, a well-known tech corporation worldwide, it also lends significant credibility to your resume.
It might not be the greatest option, though, for people who are looking for more complex, theory-heavy material or who have prior BI experience.
However, it is a wise time and financial investment for early-career learners since it provides the perfect blend of industry relevance, skill development, and accessibility.
FAQ
Which tools are covered in this course?
You’ll use SQL, BigQuery, Looker Studio, Tableau, and Google Sheets.
Does this course provide a certificate?
Yes, upon completion, you’ll receive the Google Business Intelligence Professional Certificate, shareable on LinkedIn.
Is this certificate recognized by employers?
Yes. It’s part of the Google Career Certificates program, which is trusted by employers globally.
Share Now
Related Articles
IBM RAG and Agentic AI Professional Certificate – A Detailed Review
What is Data Storytelling? A Guide to Turning Numbers into Narratives
Should You Learn Python Or R For Data Science?
As an engineer with a passion for learning and sharing knowledge, I created CourseKart.online to help students, professionals, and lifelong learners choose the best online courses. With so many options available, finding the right one can be overwhelming. My goal is to simplify that process by offering insights, reviews, and recommendations on the top online learning resources. I hope my posts inspire you to keep growing, learning, and exploring new opportunities.
Discover more from coursekart.online
Subscribe to get the latest posts sent to your email.